This notebook demonstrates the StructuralFeatures and SpectralFeatures
transformers, which compute fixed-dimensional node features from graph
topology alone.
%matplotlib inline
import numpy as np
import matplotlib.pyplot as plt

from nocd import NOCD, StructuralFeatures, SpectralFeatures
from nocd.data import load_dataset
from nocd.metrics import overlapping_nmi, evaluate_unsupervised
/home/runner/work/nocd/nocd/.venv/lib/python3.14/site-packages/tqdm/auto.py:21: TqdmWarning: IProgress not found. Please update jupyter and ipywidgets. See https://ipywidgets.readthedocs.io/en/stable/user_install.html
from .autonotebook import tqdm as notebook_tqdm
graph = load_dataset('../data/facebook_ego/fb_698.npz')
A, X, Z_gt = graph['A'], graph['X'], graph['Z']
N, K = Z_gt.shape
print(f'Graph: {N} nodes, {A.nnz} edges, {K} communities')
Graph: 66 nodes, 540 edges, 13 communities
/home/runner/work/nocd/nocd/.venv/lib/python3.14/site-packages/numpy/lib/_format_impl.py:838: VisibleDeprecationWarning: dtype(): align should be passed as Python or NumPy boolean but got `align=0`. Did you mean to pass a tuple to create a subarray type? (Deprecated NumPy 2.4)
  array = pickle.load(fp, **pickle_kwargs)
StructuralFeatures transformer
Computes 9 topology-derived features per node: normalized degree, log-degree, clustering coefficient, square clustering, average neighbor degree, PageRank, HITS hub/authority scores, and core number.
sf = StructuralFeatures()
X_struct = sf.fit_transform(A)
print(f'Structural features: {X_struct.shape}')
print(f'Sample (node 0): {X_struct[0]}')
Structural features: (66, 9)
Sample (node 0): [0.3448276 0.70501506 0.9111111 0. 0.9734375 0.32408214
0.5985451 0.5985451 0.8333333 ]
names = ['degree', 'log_deg', 'clust', 'sq_clust',
         'avg_nbr_deg', 'pagerank', 'hub', 'auth', 'core']

fig, axes = plt.subplots(3, 3, figsize=(12, 10))
for i, (ax, name) in enumerate(zip(axes.flat, names)):
    ax.hist(X_struct[:, i], bins=30, alpha=0.7)
    ax.set_title(name)
plt.suptitle('Structural Feature Distributions', fontsize=14)
plt.tight_layout()
plt.show()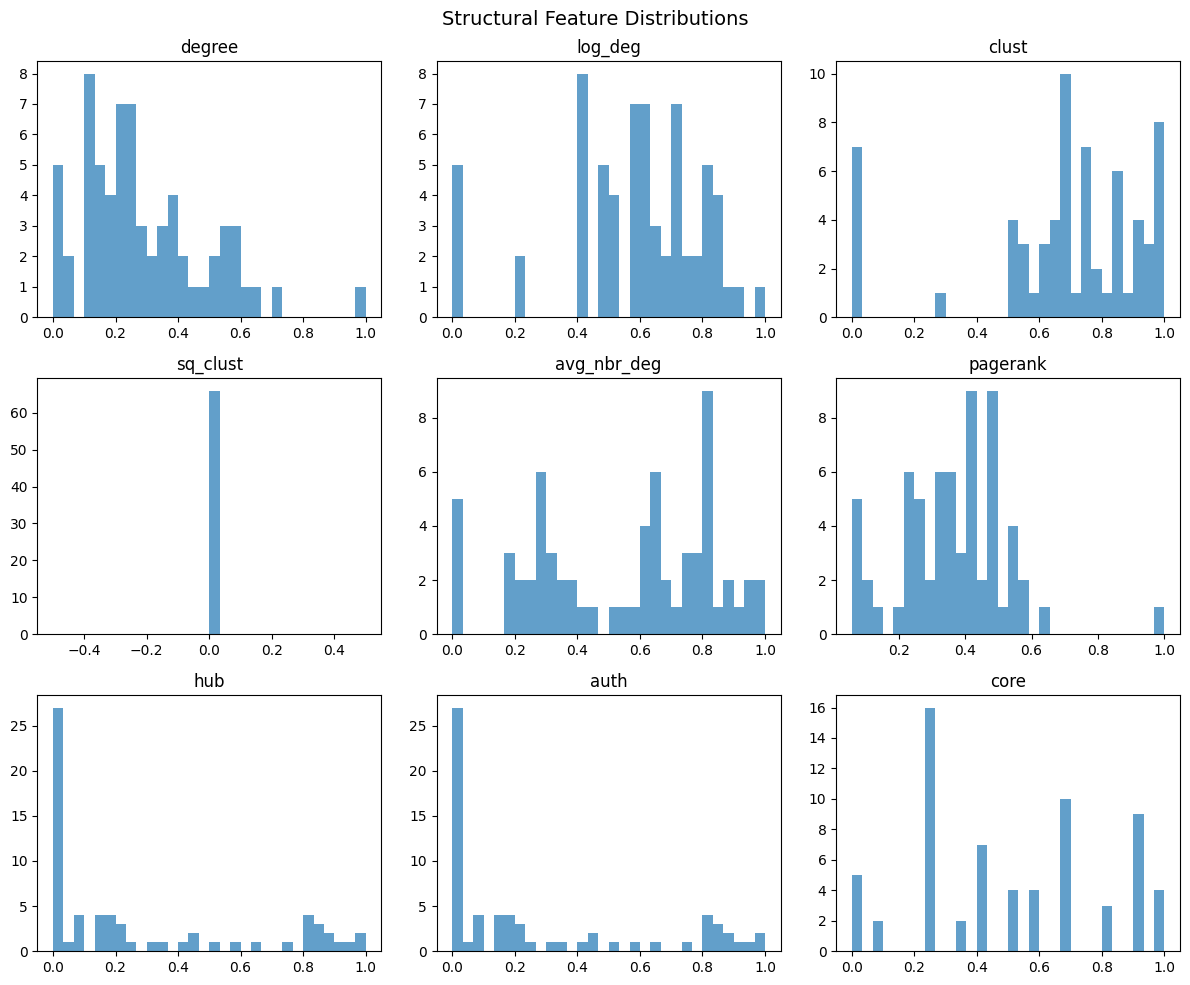
SpectralFeatures transformer
Computes the top-k smallest non-trivial eigenvectors of the normalized graph Laplacian.
spf = SpectralFeatures(n_components=16)
X_spec = spf.fit_transform(A)
print(f'Spectral features: {X_spec.shape}')
Spectral features: (66, 16)
z_gt_label = np.argmax(Z_gt, axis=1)

fig, ax = plt.subplots(figsize=(8, 6))
scatter = ax.scatter(X_spec[:, 0], X_spec[:, 1], c=z_gt_label,
                     cmap='tab20', s=5, alpha=0.7)
ax.set_xlabel('Spectral component 1')
ax.set_ylabel('Spectral component 2')
ax.set_title('Spectral embedding colored by ground-truth community')
plt.colorbar(scatter, label='Community')
plt.tight_layout()
plt.show()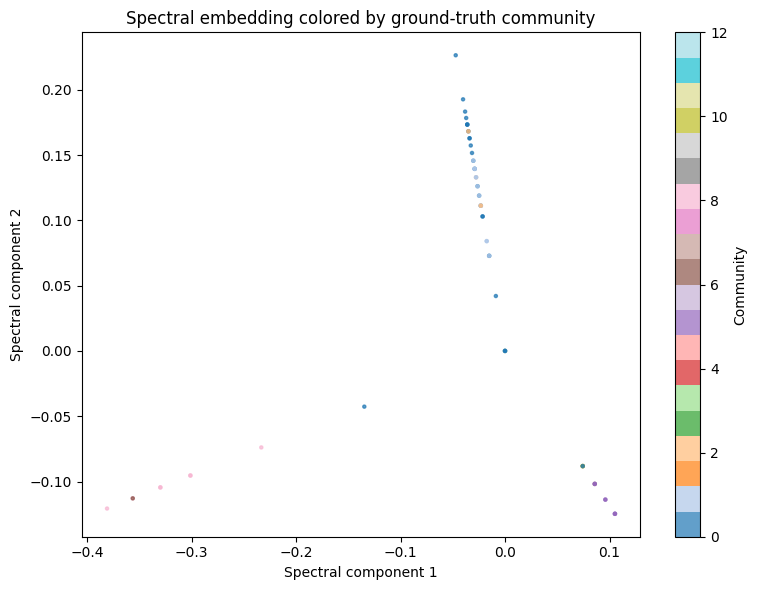
Comparison across feature types and models
Train all combinations and build a summary table.
results = []

configs = [
    ('gcn', 'X', dict(hidden_dims=(64,), batch_norm=True)),
    ('gcn', 'structural', dict(hidden_dims=(32, 16), batch_norm=True)),
    ('gcn', 'spectral', dict(hidden_dims=(32, 16), batch_norm=True, n_components=16)),
    ('improved', 'X', dict(hidden_dims=(64,))),
    ('improved', 'structural', dict(hidden_dims=(32, 16))),
    ('improved', 'spectral', dict(hidden_dims=(32, 16), n_components=16)),
]

for model_type, feat_type, kwargs in configs:
    label = f'{model_type} / {feat_type}'
    print(f'Training {label}...')
    m = NOCD(
        num_communities=K,
        model_type=model_type,
        feature_type=feat_type,
        max_epochs=200,
        display_step=200,
        patience=50,
        batch_size=5000,
        **kwargs,
    )
    m.fit(A, X, y=Z_gt, verbose=False)
    Z_pred = m.predict(A, X)
    nmi = overlapping_nmi(Z_pred, Z_gt)
    unsup = evaluate_unsupervised(Z_pred, A)
    results.append({
        'Model': model_type,
        'Features': feat_type,
        'NMI': round(float(nmi), 4),
        'Coverage': round(float(unsup['coverage']), 4),
        'Conductance': round(float(unsup['conductance']), 4),
    })
    print(f'  NMI={nmi:.4f}, Coverage={unsup["coverage"]:.4f}')
Training gcn / X...
  NMI=0.3960, Coverage=0.8667
Training gcn / structural...
  NMI=0.4411, Coverage=0.8778
Training gcn / spectral...
  NMI=0.4517, Coverage=0.9259
Training improved / X...
  NMI=0.1386, Coverage=0.2667
Training improved / structural...
  NMI=0.0000, Coverage=0.0000
Training improved / spectral...
/home/runner/work/nocd/nocd/nocd/metrics/unsupervised.py:70: RuntimeWarning: invalid value encountered in divide
  com_sizes = Z_pred.sum(0) / Z_pred.sum()
/home/runner/work/nocd/nocd/nocd/metrics/unsupervised.py:103: RuntimeWarning: invalid value encountered in scalar divide
  return conductances @ com_sizes / com_sizes.sum()
/home/runner/work/nocd/nocd/nocd/metrics/unsupervised.py:37: RuntimeWarning: invalid value encountered in scalar divide
  return clust_coefs @ com_sizes / com_sizes.sum()
NMI=0.0348, Coverage=0.2481
# Display as a table
print(f'{"Model":<12} {"Features":<14} {"NMI":>8} {"Coverage":>10} {"Conductance":>13}')
print('-' * 60)
for r in results:
    print(f'{r["Model"]:<12} {r["Features"]:<14} {r["NMI"]:>8.4f} {r["Coverage"]:>10.4f} {r["Conductance"]:>13.4f}')
Model Features NMI Coverage Conductance
------------------------------------------------------------
gcn X 0.3960 0.8667 0.1724
gcn structural 0.4411 0.8778 0.1975
gcn spectral 0.4517 0.9259 0.1569
improved X 0.1386 0.2667 0.4893
improved structural 0.0000 0.0000 nan
improved spectral 0.0348 0.2481 0.6031
# Plot NMI comparison
models = [f'{r["Model"]}\n{r["Features"]}' for r in results]
nmis = [r['NMI'] for r in results]

fig, ax = plt.subplots(figsize=(10, 5))
colors = ['#2196F3' if 'gcn' in m else '#FF9800' for m in models]
bars = ax.bar(range(len(models)), nmis, color=colors, alpha=0.8)
ax.set_xticks(range(len(models)))
ax.set_xticklabels(models, fontsize=10)
ax.set_ylabel('Overlapping NMI')
ax.set_title('Community Detection: Model x Feature Type')
for bar, nmi in zip(bars, nmis):
    ax.text(bar.get_x() + bar.get_width()/2, bar.get_height() + 0.01,
            f'{nmi:.3f}', ha='center', fontsize=9)
plt.tight_layout()
plt.show()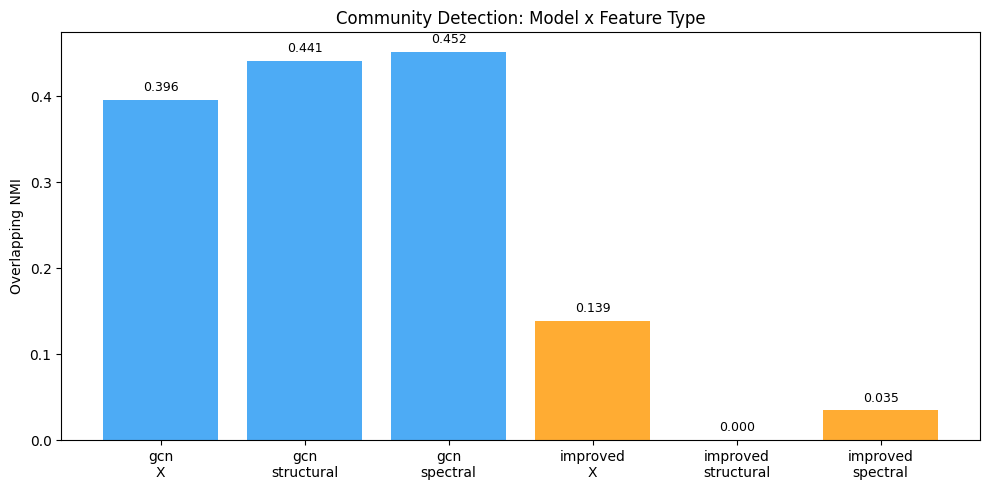
Cross-graph transfer
A model trained with structural features on one graph can be applied to a different graph.
# Train on fb_698
m_struct = NOCD(
    num_communities=K,
    model_type='gcn',
    hidden_dims=(32, 16),
    feature_type='structural',
    batch_norm=True,
    max_epochs=200,
    display_step=200,
    patience=50,
    batch_size=5000,
)
m_struct.fit(A, y=Z_gt, verbose=False)

# Apply to fb_348 (different graph)
graph2 = load_dataset('../data/facebook_ego/fb_348.npz')
A2, Z_gt2 = graph2['A'], graph2['Z']
print(f'Source graph: {N} nodes, {A.nnz} edges')
print(f'Target graph: {A2.shape[0]} nodes, {A2.nnz} edges')

Z_transfer = m_struct.predict(A2)
unsup = evaluate_unsupervised(Z_transfer, A2)
print(f'\nTransfer unsupervised metrics:')
for k, v in unsup.items():
    print(f'  {k}: {v:.4f}')
Source graph: 66 nodes, 540 edges
Target graph: 227 nodes, 6384 edges
Transfer unsupervised metrics:
coverage: 0.6391
density: 0.5827
conductance: 0.3366
clustering_coef: 0.3014
/home/runner/work/nocd/nocd/.venv/lib/python3.14/site-packages/numpy/lib/_format_impl.py:838: VisibleDeprecationWarning: dtype(): align should be passed as Python or NumPy boolean but got `align=0`. Did you mean to pass a tuple to create a subarray type? (Deprecated NumPy 2.4)
  array = pickle.load(fp, **pickle_kwargs)